UX Research
Qualitative data gathering
UI
Kadefarm
Kadefarm
Kadefarm
Product overview
To support Kadefarm’s sales goals, a targeted project was initiated to optimize their landing page for higher conversion rates. Insights from this research informed a redesign focused on simplifying product discovery, enhancing information clarity, and creating a seamless purchase flow.
Qualitative data gathering
Behavioral analysis | Pain points
Visual overload
Users lose focus due to an excessive number of visual elements that draw their attention away from the product and the CTA.
Dead Clicks
Users often clicked on static images and visual elements that lacked interactive functions. These actions, referred to as "rage clicks," indicate that users expected additional features or information related to the graphics but received no system response.
Lack of interaction
Product cards are not linked to further steps, preventing users from clicking to obtain additional information about the products and ultimately making a purchase.
Hipothesis
Users struggle to access product information and navigate the CTA, which affects click rate conversion
Recommendations | Design changes
Recommendations | Design changes
Interaction design
Streamlining the layout and increasing user focus on interface elements such as key CTA buttons and making product cards clickable across their entire surface.
CENEO CTA conversion
increasing the number of Ceneo CTA URLs from 1 to 3, i.e., in Version [A], we go to a single point on Ceneo (listing), whereas in Version [B], we go to the listing plus separately to product pages on Ceneo
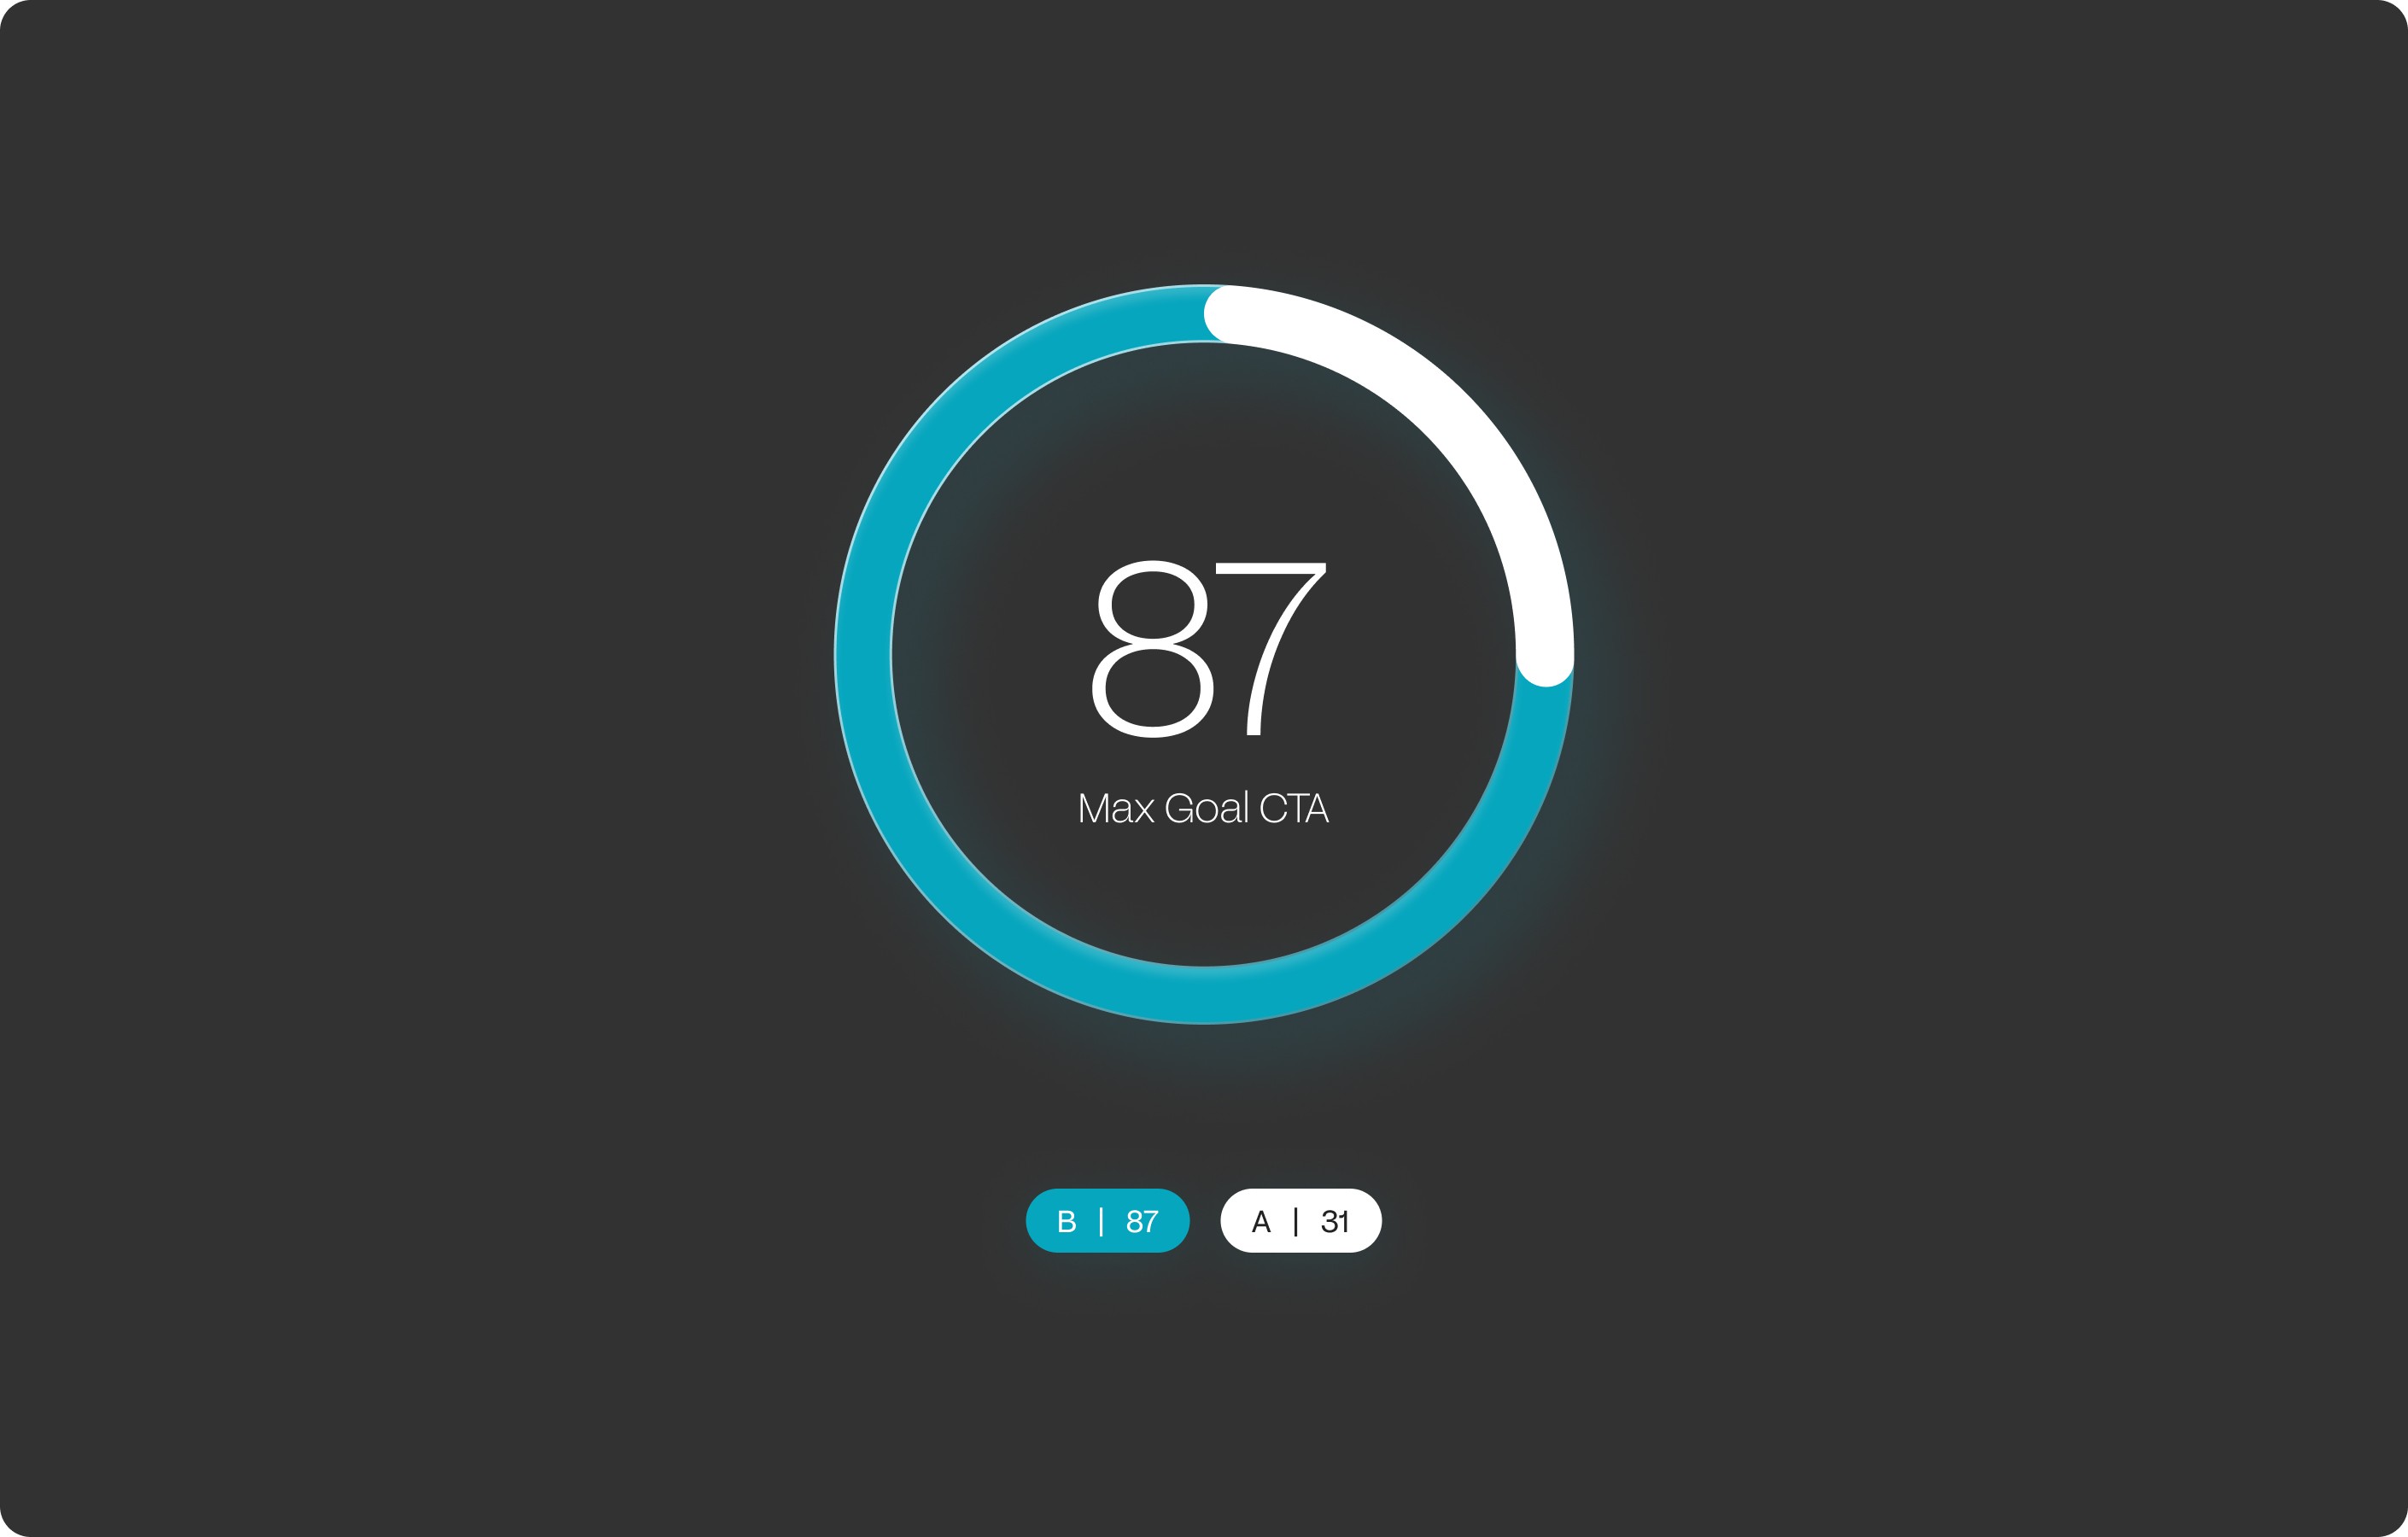
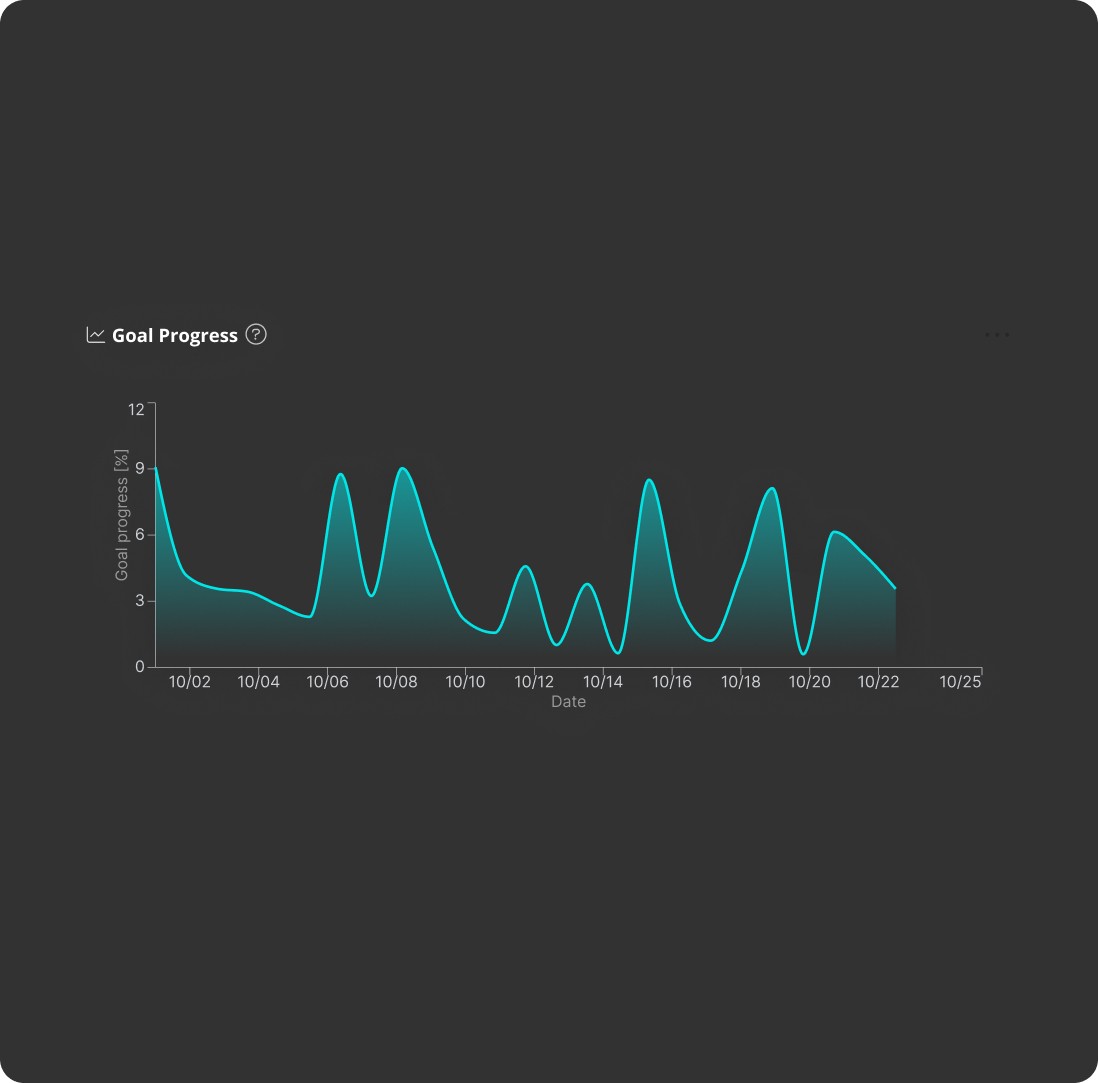
Goal conversions | CTA Clicks
Comparison of results before and after changes. The chart shows the conversion of the CTA button over a two-week period. Version A had 31 entries, whereas after the changes, the same timeframe saw 87 entries.
UX Research
Status report
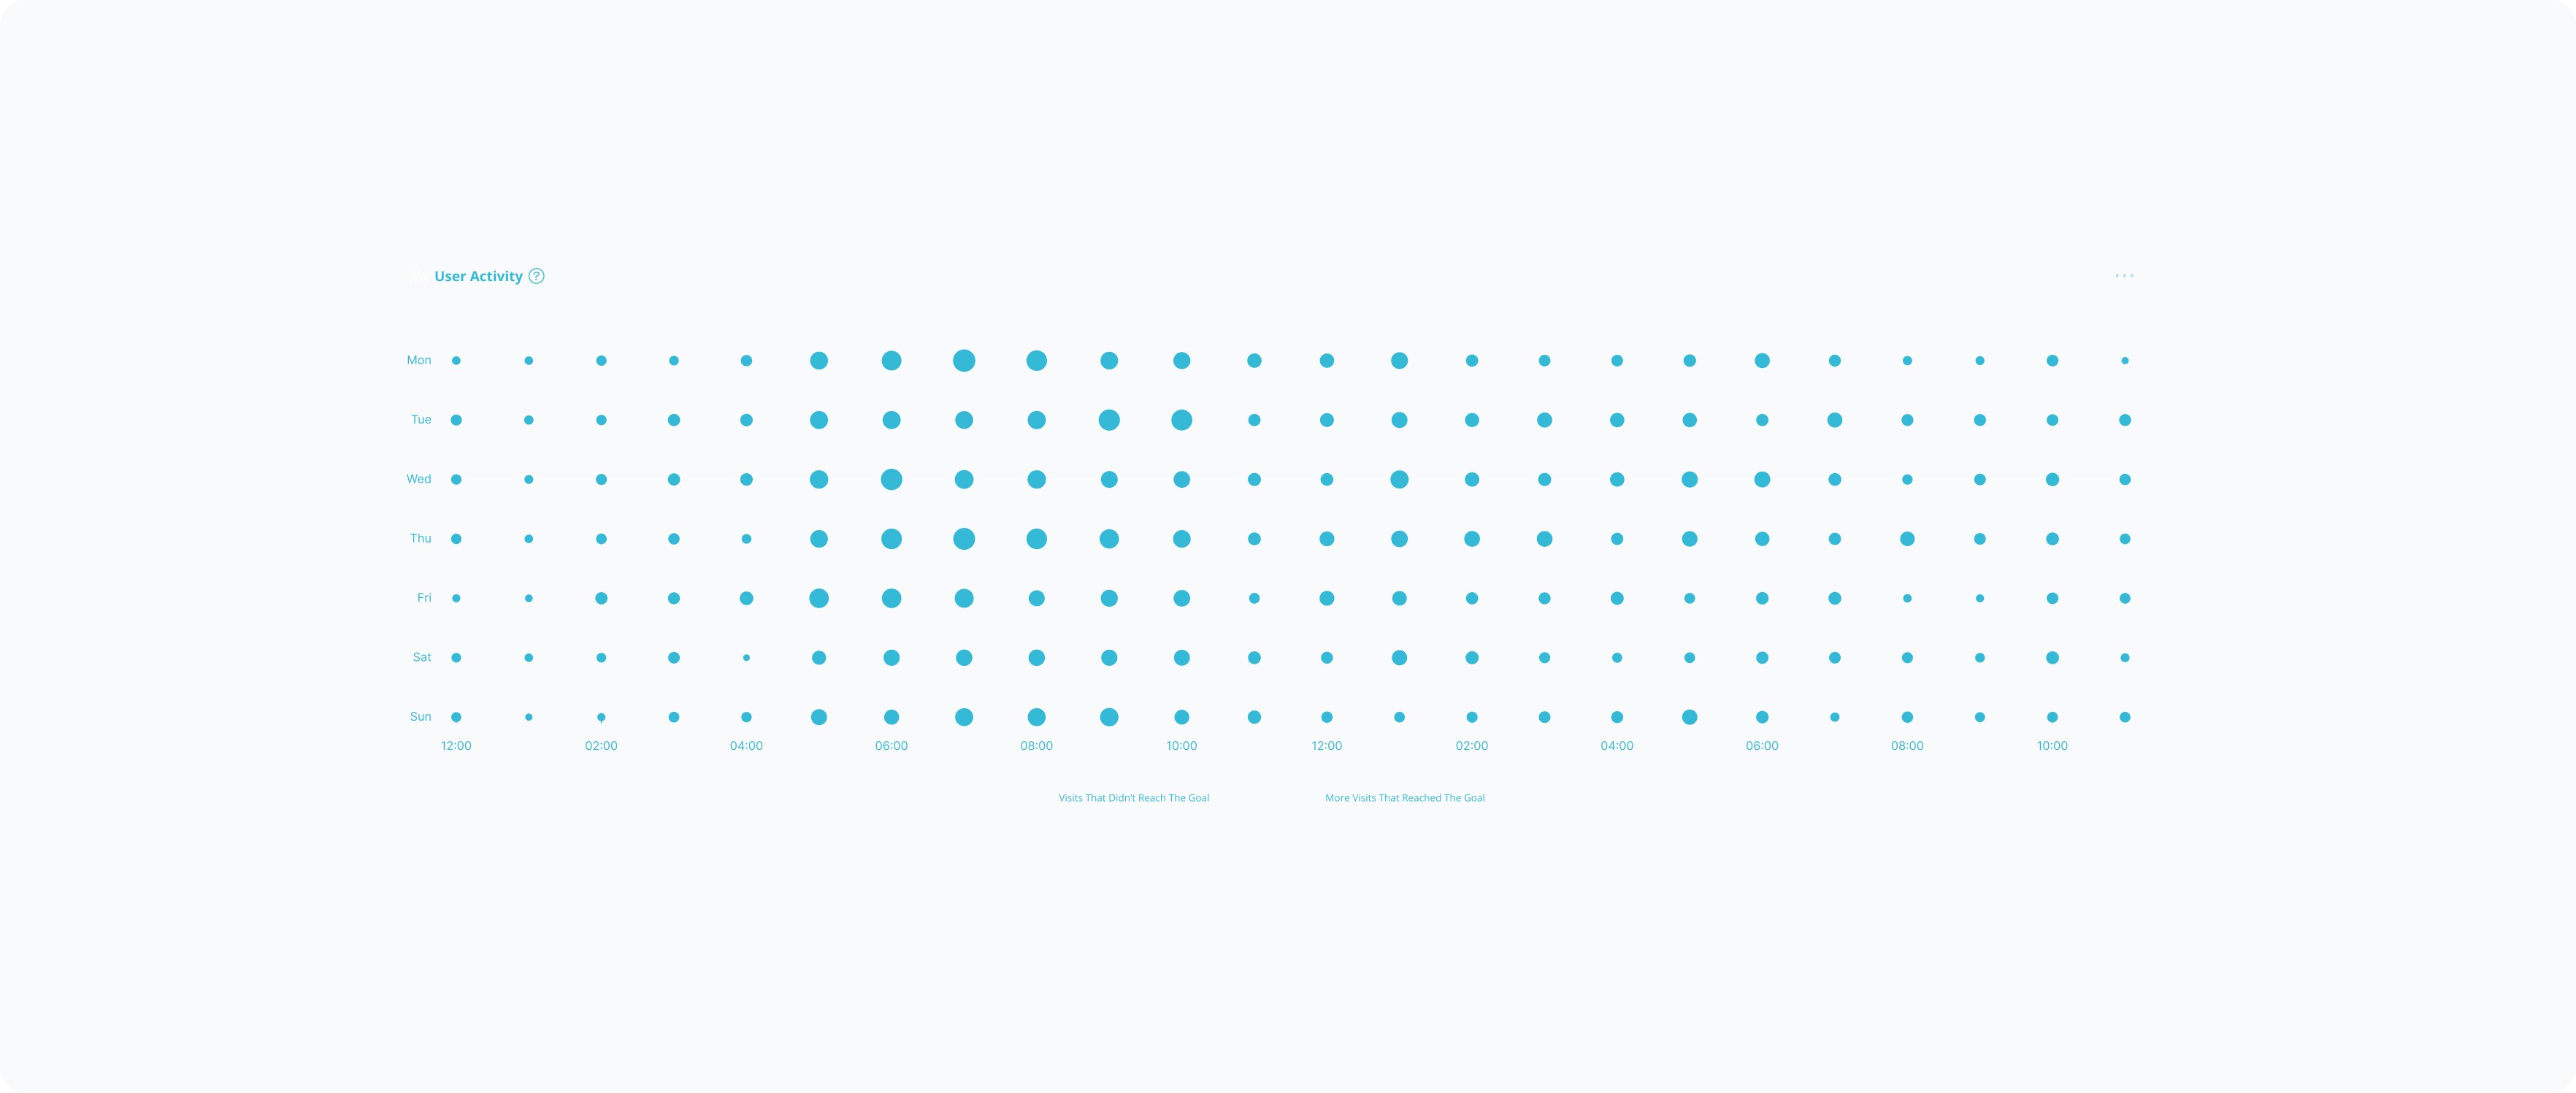
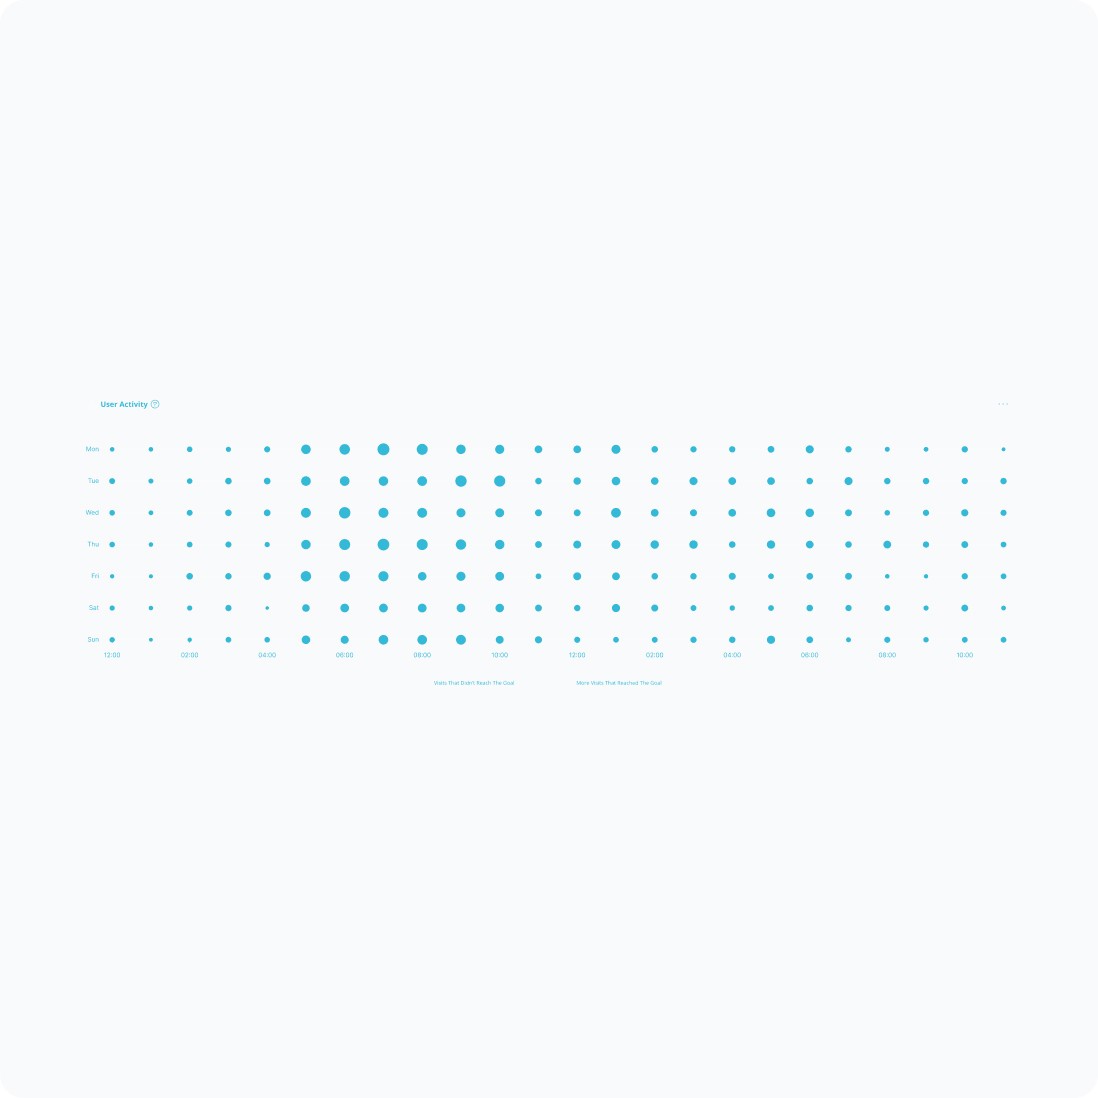
Qualitative data consists of observations and recordings that help understand user behaviors in a specific segment of the process. Recordings and behavioral analysis allow tracking interactions in real-time, enabling optimization and improvement of experiences. This is an analysis of a particular segment of the user journey that may be problematic for users and ultimately cause them to exit the sales funnel.
UX Research
Status report
Qualitative data consists of observations and recordings that help understand user behaviors in a specific segment of the process. Recordings and behavioral analysis allow tracking interactions in real-time, enabling optimization and improvement of experiences. This is an analysis of a particular segment of the user journey that may be problematic for users and ultimately cause them to exit the sales funnel.
After — CTA CENEO [B/87] — [01.10.2024-14.10.2024]
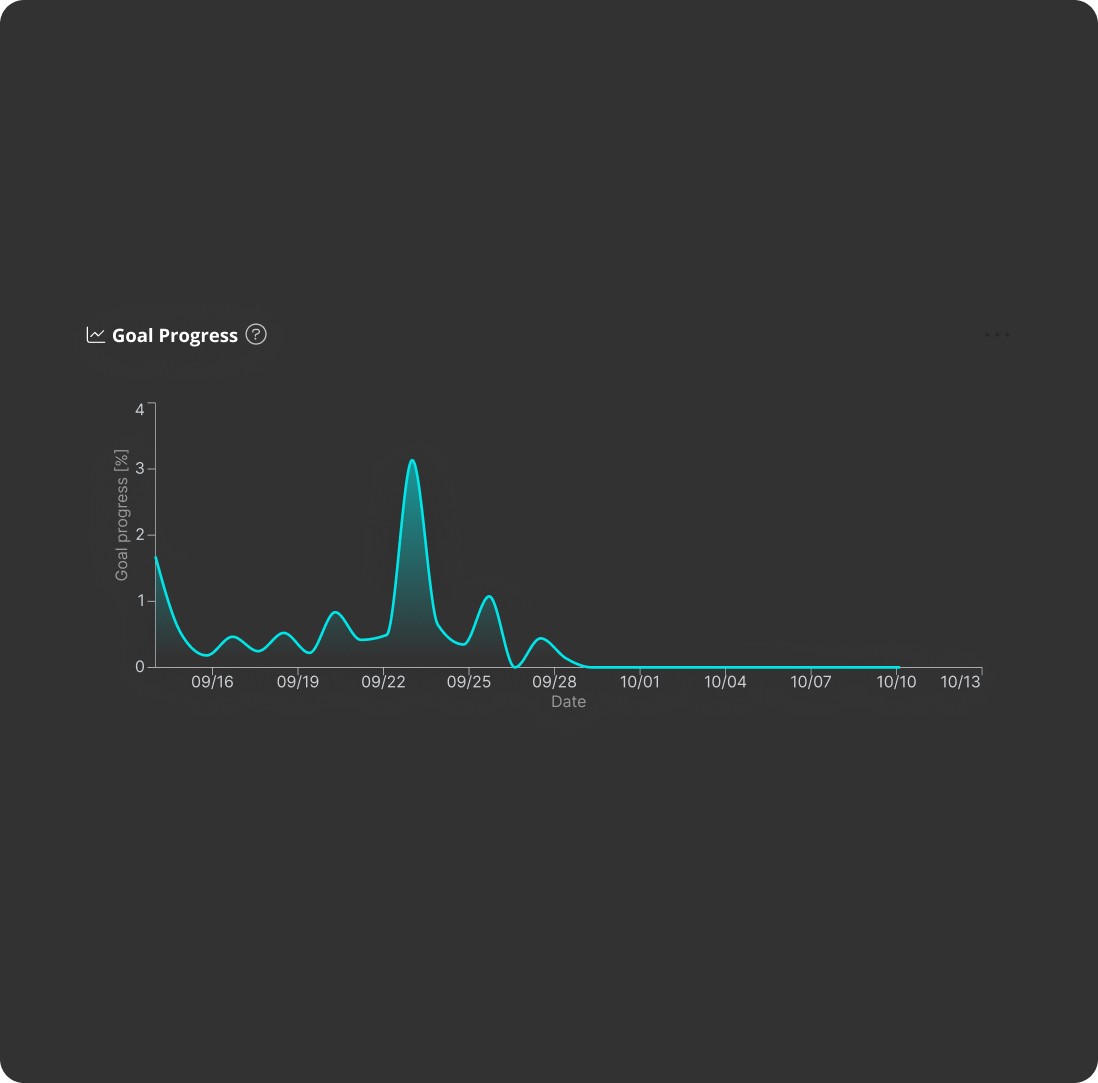
Before — CTA CENEO [A/31] — [14.09.2024-30.09.2024]
Comparison of results before and after changes. The chart shows the conversion of the CTA button over a two-week period. Version A had 31 entries, whereas after the changes, the same timeframe saw 87 entries.
Goal conversions | CTA Clicks
Comparison of results before and after changes. The chart shows the conversion of the CTA button over a two-week period. Version A had 31 entries, whereas after the changes, the same timeframe saw 87 entries.
Results & impact
The introduced changes improve the smoothness of operation and reduce the time needed to navigate to the product card. Clicks on the packshot and transitions to Ceneo are now more efficient. The number of chaotic scroll events has decreased, which may indicate an overall improvement in the information architecture of the page and the overall product experience.
Average session time
measures the average time users spend on the website.
Average time A
2.38
Average time B
3.07
Session depth
measures how many pages a user visits during a single session.
Session depth A
2.54
Session depth B
2.77
Session engagement
measures sessions that meet any of the following criteria: last longer than 10 seconds, include a key event, or involve at least 2 screen or page views.
Engagement A
1770
Engagement B
1719
UX Research
Status report
Qualitative data consists of observations and recordings that help understand user behaviors in a specific segment of the process. Recordings and behavioral analysis allow tracking interactions in real-time, enabling optimization and improvement of experiences. This is an analysis of a particular segment of the user journey that may be problematic for users and ultimately cause them to exit the sales funnel.
Recommendations | Design changes
Interaction design
Streamlining the layout and increasing user focus on interface elements such as key CTA buttons and making product cards clickable across their entire surface.
CENEO CTA conversion
increasing the number of Ceneo CTA URLs from 1 to 3, i.e., in Version [A], we go to a single point on Ceneo (listing), whereas in Version [B], we go to the listing plus separately to product pages on Ceneo
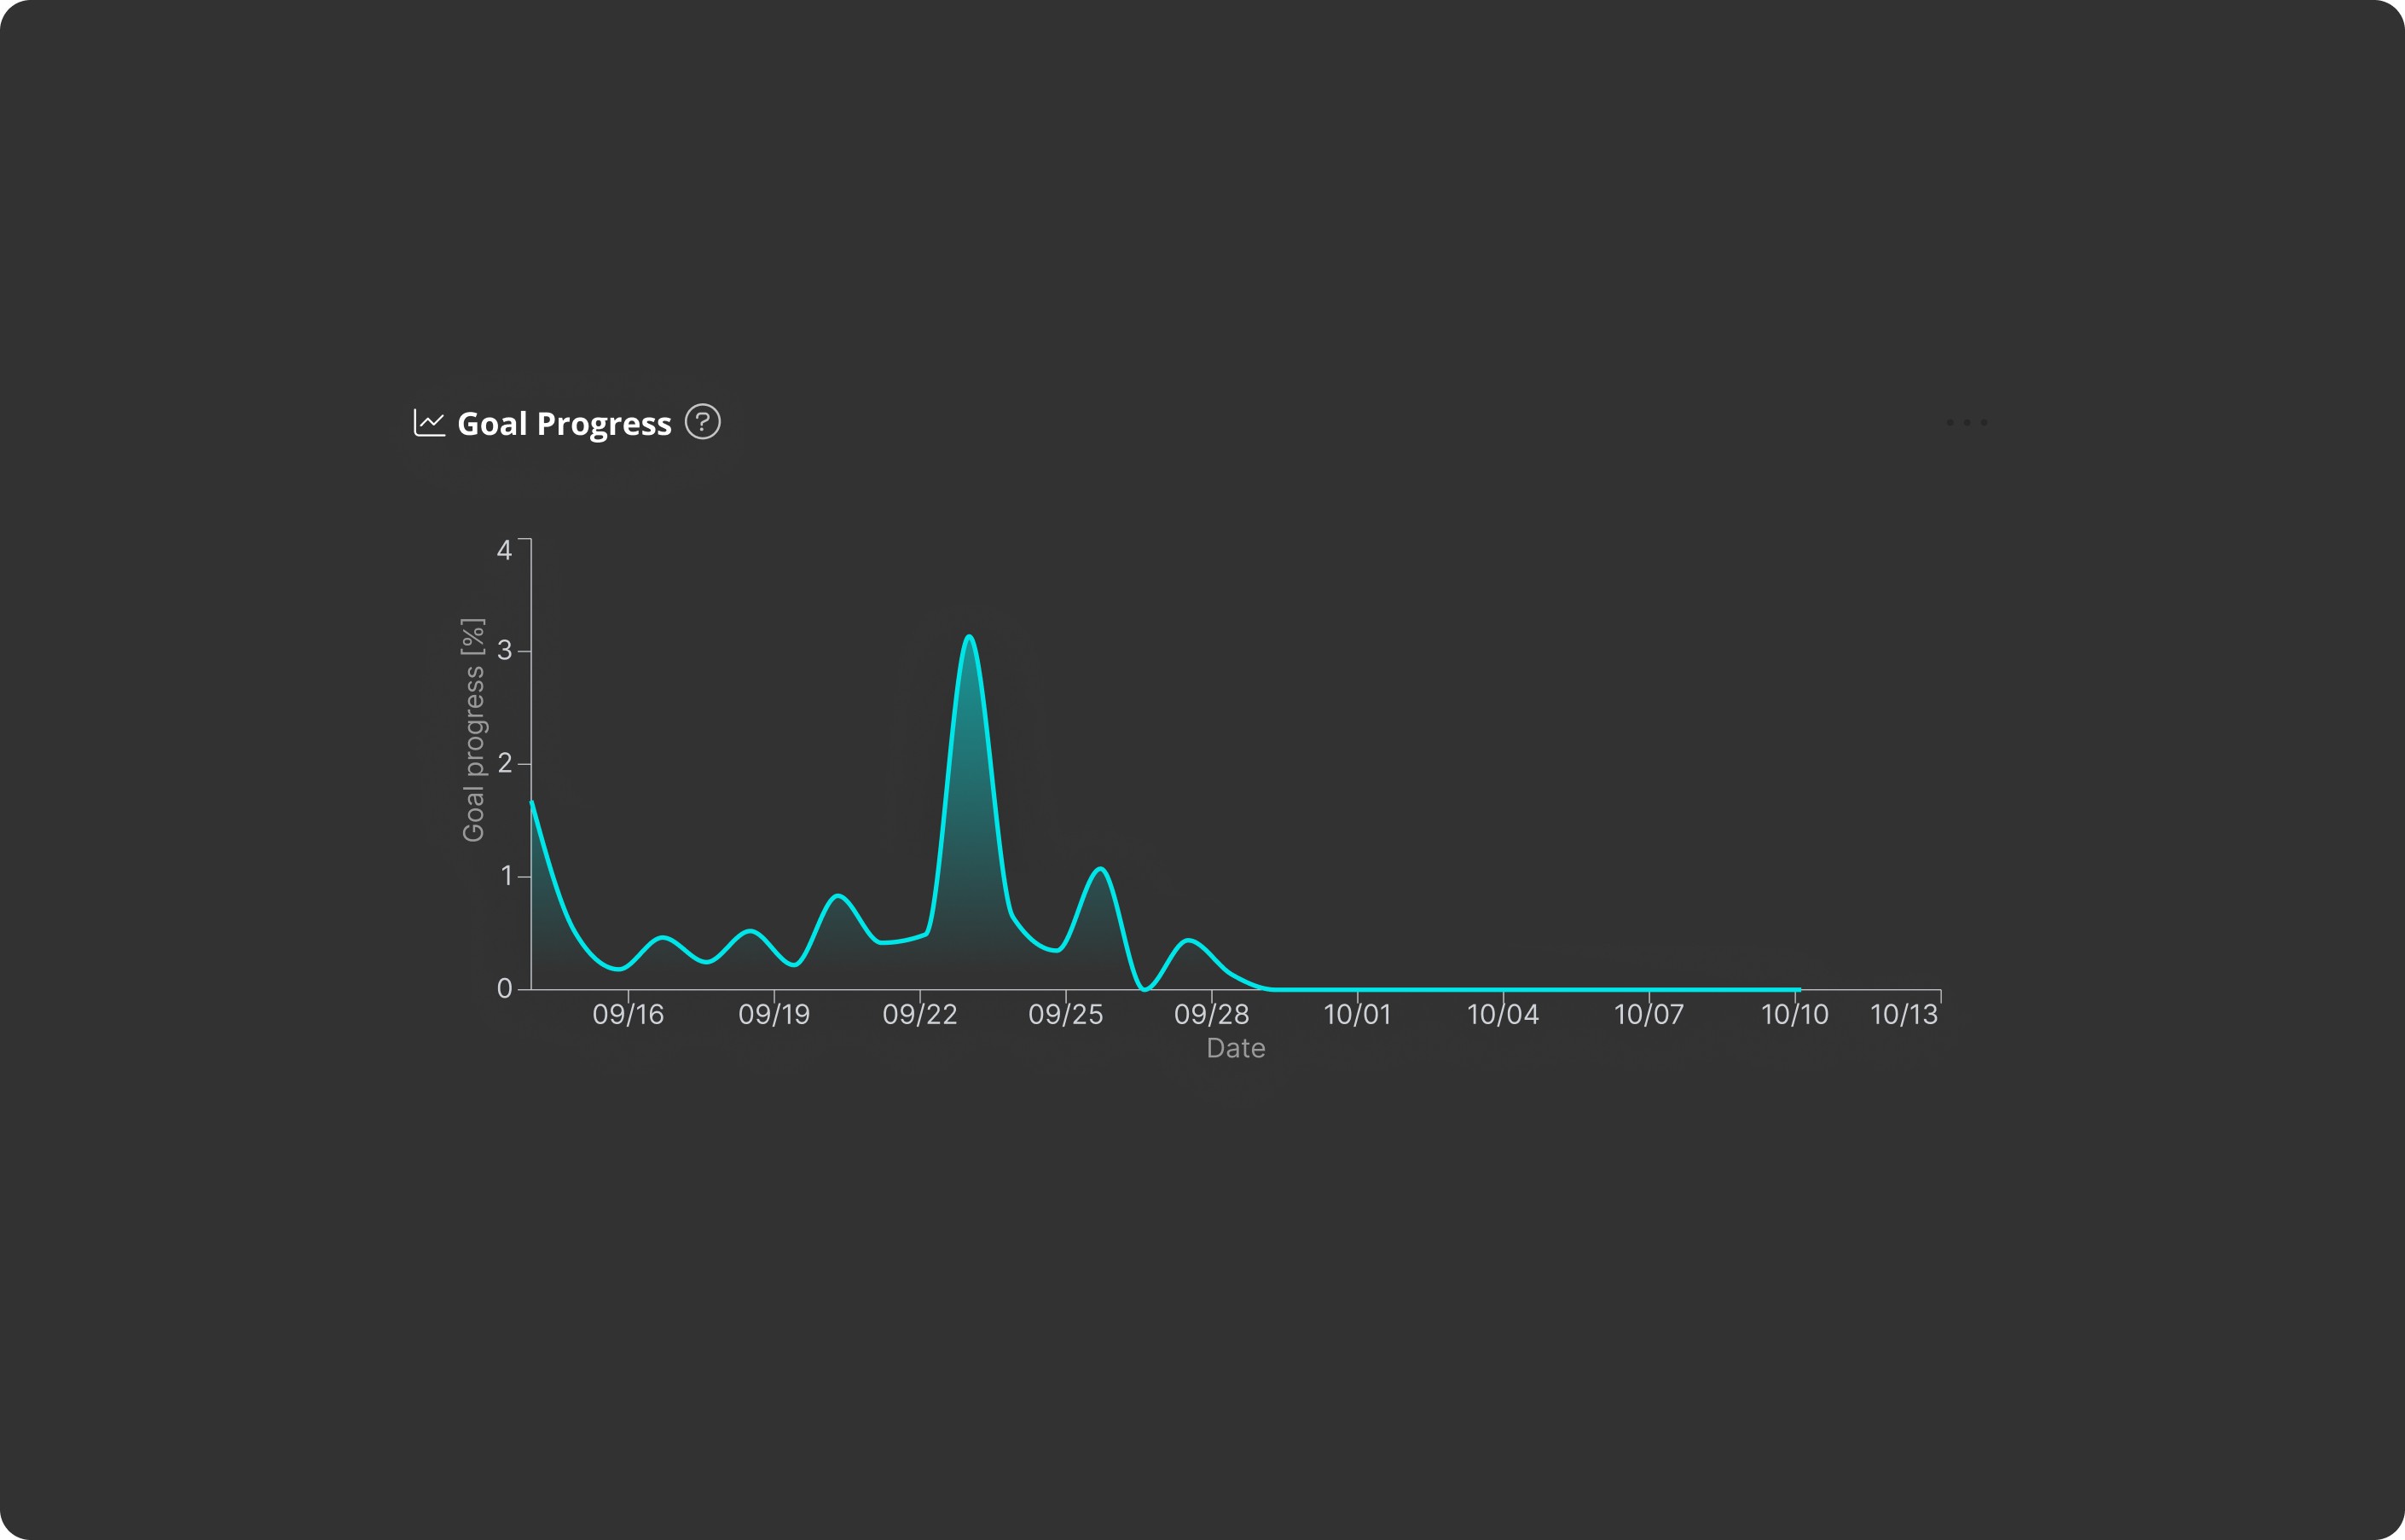
Before — CTA CENEO [A/31] — [14.09.2024-30.09.2024]
Comparison of results before and after changes. The chart shows the conversion of the CTA button over a two-week period. Version A had 31 entries, whereas after the changes, the same timeframe saw 87 entries.
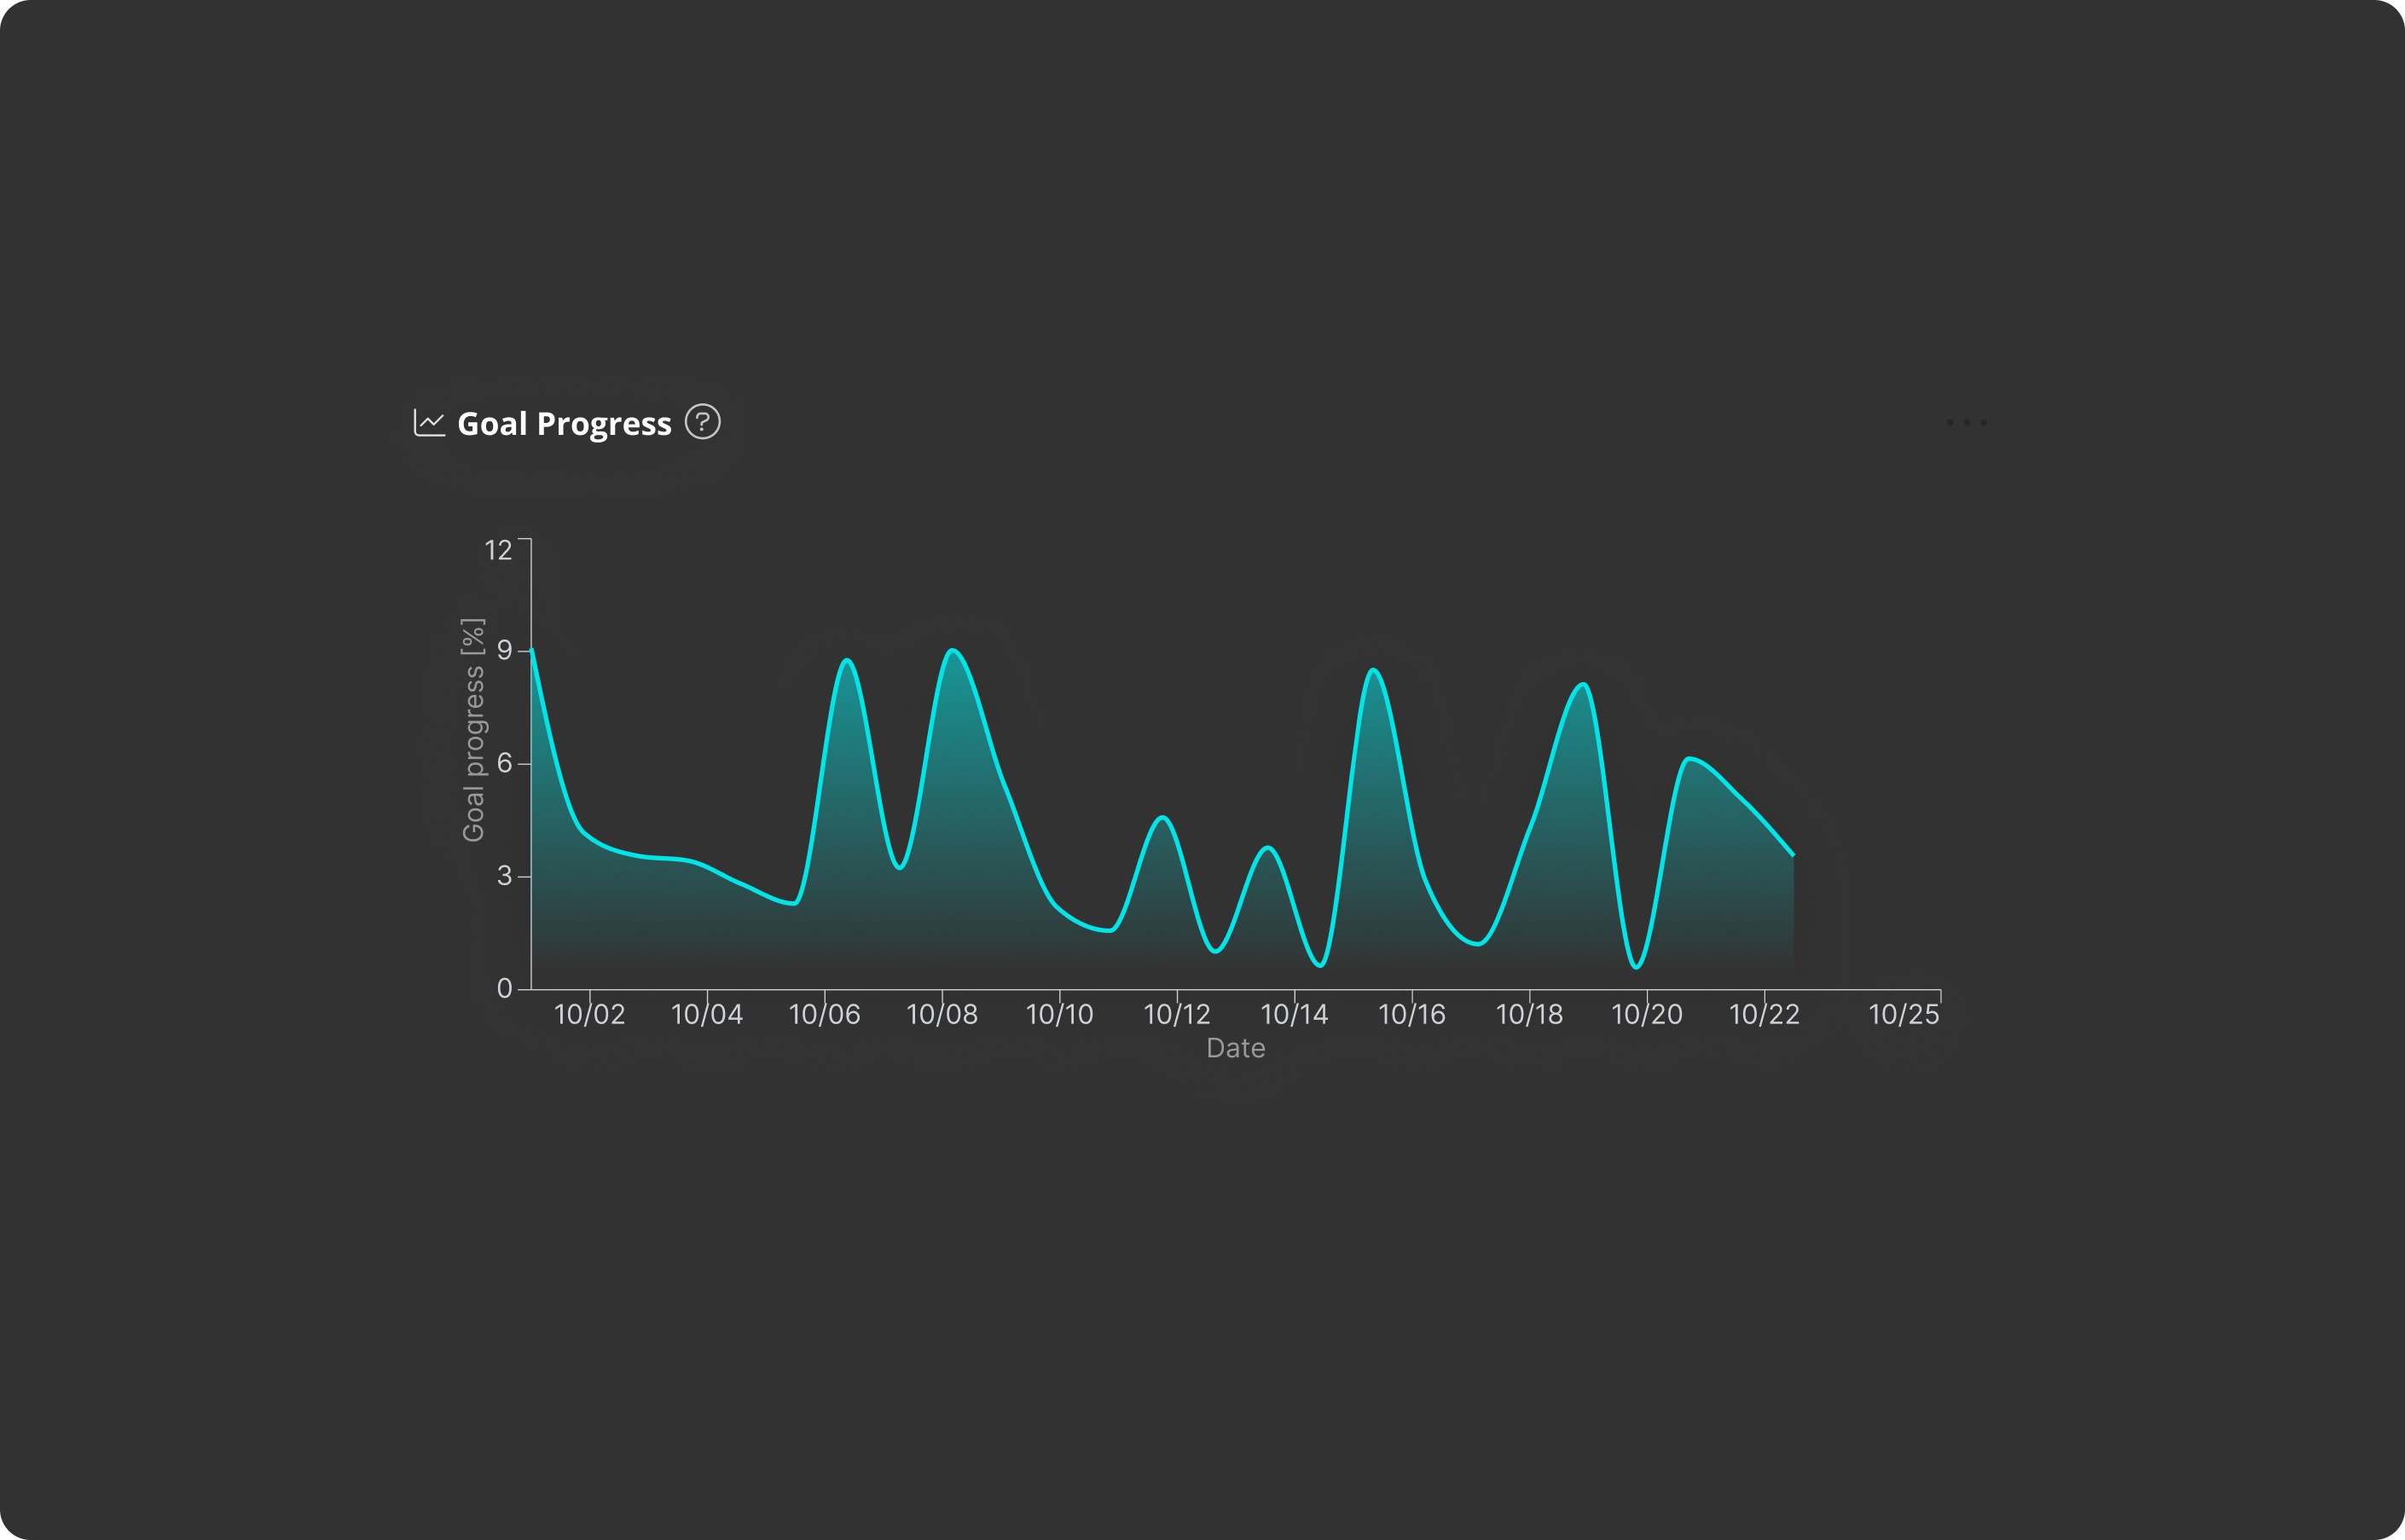
After — CTA CENEO [B/87] — [01.10.2024-14.10.2024]
Results & impact
The introduced changes improve the smoothness of operation and reduce the time needed to navigate to the product card. Clicks on the packshot and transitions to Ceneo are now more efficient. The number of chaotic scroll events has decreased, which may indicate an overall improvement in the information architecture of the page and the overall product experience.
Results & Impact
The introduced changes improve the smoothness of operation and reduce the time needed to navigate to the product card. Clicks on the packshot and transitions to Ceneo are now more efficient. The number of chaotic scroll events has decreased, which may indicate an overall improvement in the information architecture of the page and the overall product experience.
Google Analytics 4
Performance report
Report contain quantitative data on changes in user behavior on the website during the activation period of the new version of the site [B] (October 1-27) compared to the corresponding period when the previous version of the site [A] was active (September 3-30).
Google Analytics 4
Performance report
Behavioral analysis | Pain points
Report contain quantitative data on changes in user behavior on the website during the activation period of the new version of the site [B] (October 1-27) compared to the corresponding period when the previous version of the site [A] was active (September 3-30).
Visual overload
Users lose focus due to an excessive number of visual elements that draw their attention away from the product and the CTA.
Dead Clicks
Users often clicked on static images and visual elements that lacked interactive functions. These actions, referred to as "rage clicks," indicate that users expected additional features or information related to the graphics but received no system response.
Lack of interaction
Product cards are not linked to further steps, preventing users from clicking to obtain additional information about the products and ultimately making a purchase.
Average session time
Average session time
measures the average time users spend on the website.
Average session time A
2.38
Średni czas sesji B
3.07
Average session time B
3.07
Session depth
measures how many pages a user visits during a single session.
Session deph A
2.54
Session depth B
2.77
Session engagement
measures sessions that meet any of the following criteria: last longer than 10 seconds, include a key event, or involve at least 2 screen or page views.
Session engagement A
1770
Session engagement B
1719
After — CTA CENEO [B/87] — [01.10.2024-14.10.2024]
Session engagement
measures sessions that meet any of the following criteria: last longer than 10 seconds, include a key event, or involve at least 2 screen or page views.
Session engagement B
1719
Session engagement A
1770
Session depth
measures how many pages a user visits during a single session.
Session depth A
2.54
Session depth B
2.77
Other projects
Curious to see more? Dive deeeper.
Sustainability
Kindly report
Userflow
•
Onboarding
•
Dashboard
Platform designed to help users report illegal parking. It auomates the process by generating accurate and complete reports sent to local law enforcement.
Fintech
Santander
Loan form process
•
UX/UI
•
UX Writnig
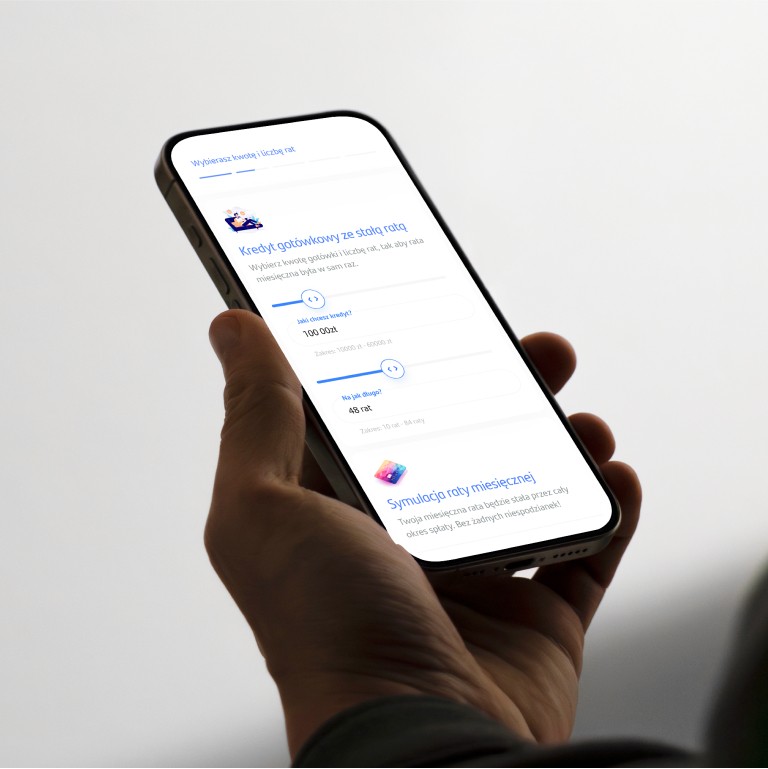
Loan simulator makes getting a loan easy and quick. You can choose how much you want to borrow and for how long using simple sliders.
Fintech
Santander
Loan form process
•
UX/UI
•
UX Writnig
Loan simulator makes getting a loan easy and quick. You can choose how much you want to borrow and for how long using simple sliders.
Platform designed to help users report illegal parking. It auomates the process by generating accurate and complete reports sent to local law enforcement.
Kindly report
Userflow
•
Onboarding
•
Dashboard
Sustainability
Other projects
Curious to see more? Dive deeeper.
Fintech
Santander
Loan form process
•
UX/UI
•
UX Writnig
Loan simulator makes getting a loan easy and quick. You can choose how much you want to borrow and for how long using simple sliders.
Sustainability
Kindly report
Userflow
•
Onboarding
•
Dashboard
Platform designed to help users report illegal parking. It auomates the process by generating accurate and complete reports sent to local law enforcement.
Other projects
Curious to see more? Dive deeeper.
Qualitative data gathering
Behavioral analysis | Pain points
Visual overload
Users lose focus due to an excessive number of visual elements that draw their attention away from the product and the CTA.
Dead Clicks
Users often clicked on static images and visual elements that lacked interactive functions. These actions, referred to as "rage clicks," indicate that users expected additional features or information related to the graphics but received no system response.
Lack of interaction
Product cards are not linked to further steps, preventing users from clicking to obtain additional information about the products and ultimately making a purchase.
Goal conversions | CTA Clicks
Comparison of results before and after changes. The chart shows the conversion of the CTA button over a two-week period. Version A had 31 entries, whereas after the changes, the same timeframe saw 87 entries.